KeyLines
0
0
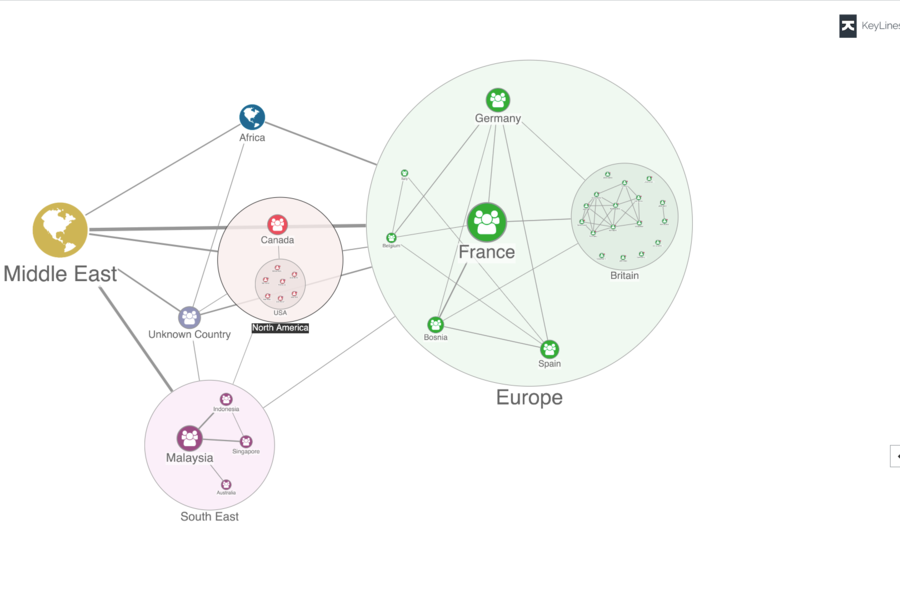
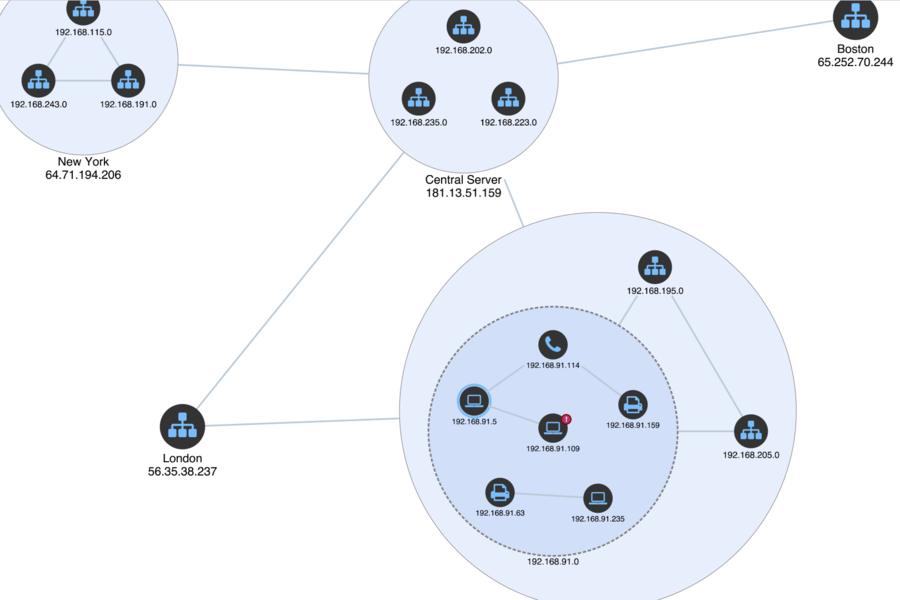
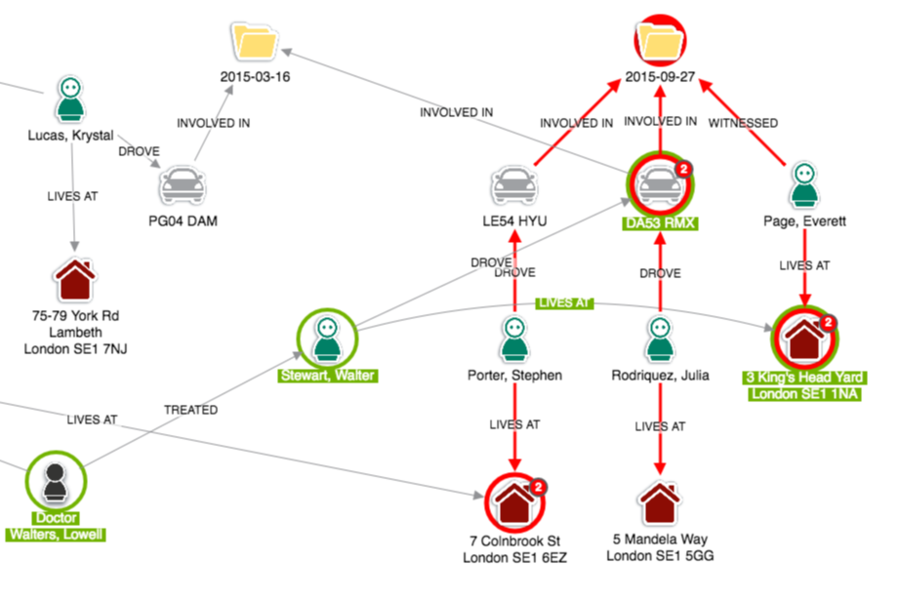
KeyLines is a JavaScript SDK for building applications that visualize and analyze complex connected data. It offers customizable design, works with any browser, device, server or database, and comes with tutorials, demos, and API documentation. KeyLines uses HTML5 and WebGL graphics rendering for high-performance graph visualization.
Strengths
-
Data Visualization
Ability to visualize complex data in an intuitive and interactive way
-
Customization
Flexible and customizable to fit specific business needs
-
Scalability
Can handle large and complex datasets with ease
Weaknesses
-
Pricing
Relatively expensive compared to other data visualization tools
-
Learning Curve
May require some training to fully utilize all features
-
Limited Integrations
May not integrate with all data sources and platforms
Opportunities
- Increasing need for data visualization tools in various industries
- Potential for new and improved features to be added in future updates
- Opportunity to form partnerships with other software providers for increased integration
Threats
- Competing data visualization tools with similar features and pricing
- Decreased demand for data visualization tools during economic downturns
- Increased focus on data security and privacy may impact adoption of data visualization tools
Ask anything of KeyLines with Workflos AI Assistant
Apolo
Squeak squeak, I'm a cute squirrel working for Workflos and selling software.
I have extensive knowledge of our software products and am committed to
providing excellent customer service.
What are the pros and cons of the current application?
How are users evaluating the current application?
How secure is the current application?
 Sign up for free
Media

KeyLines Plan
KeyLines offers a flexible pricing model based on the number of users and features, with a free trial and community version available.
SSO Free Forever
Manage BigQuery, Google Analytics, ZoomInfo, Yurbi, Verfacto, Looker, Smartlook, Mixpanel, Sisense, accessiBe with SSO