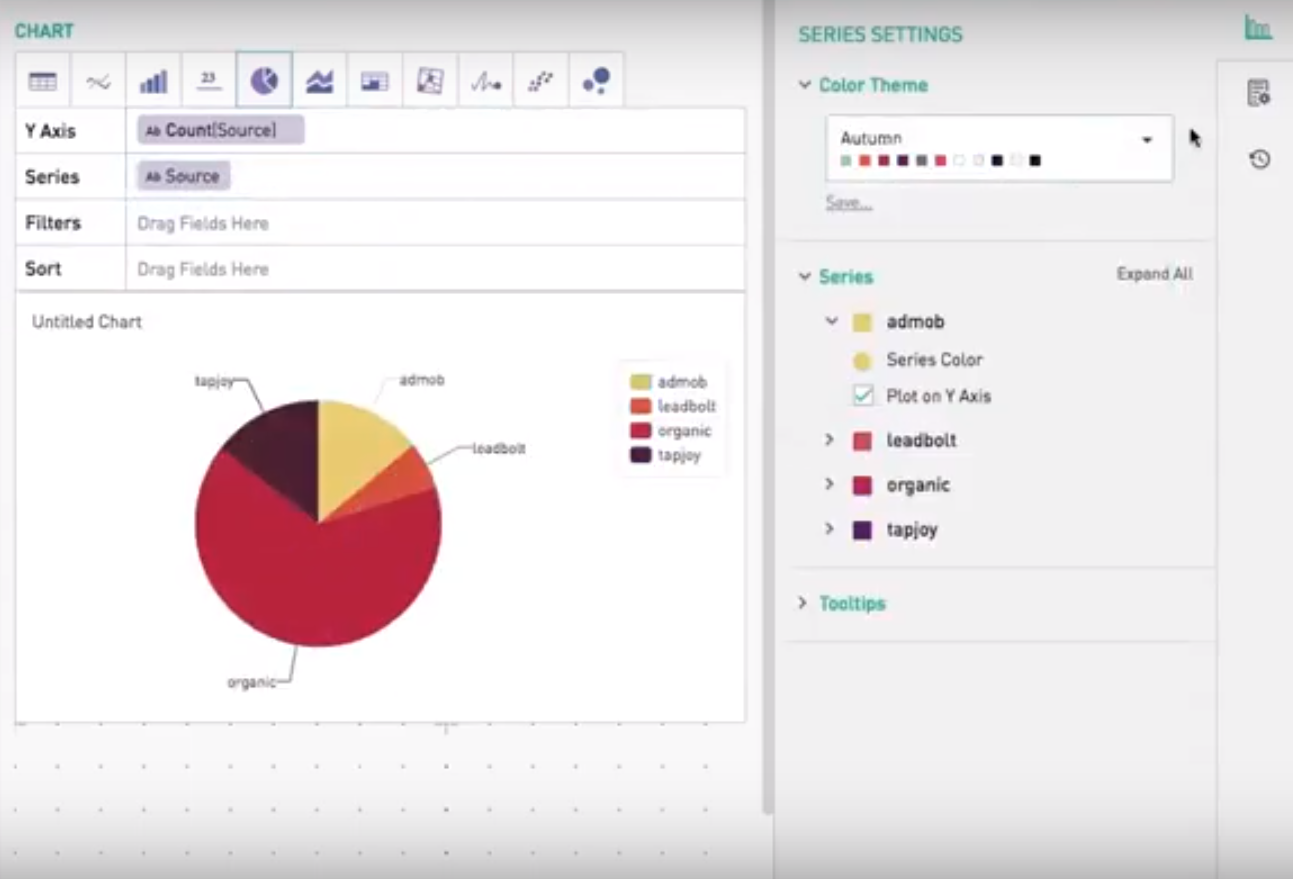
CanvasJS Charts
4.6
113
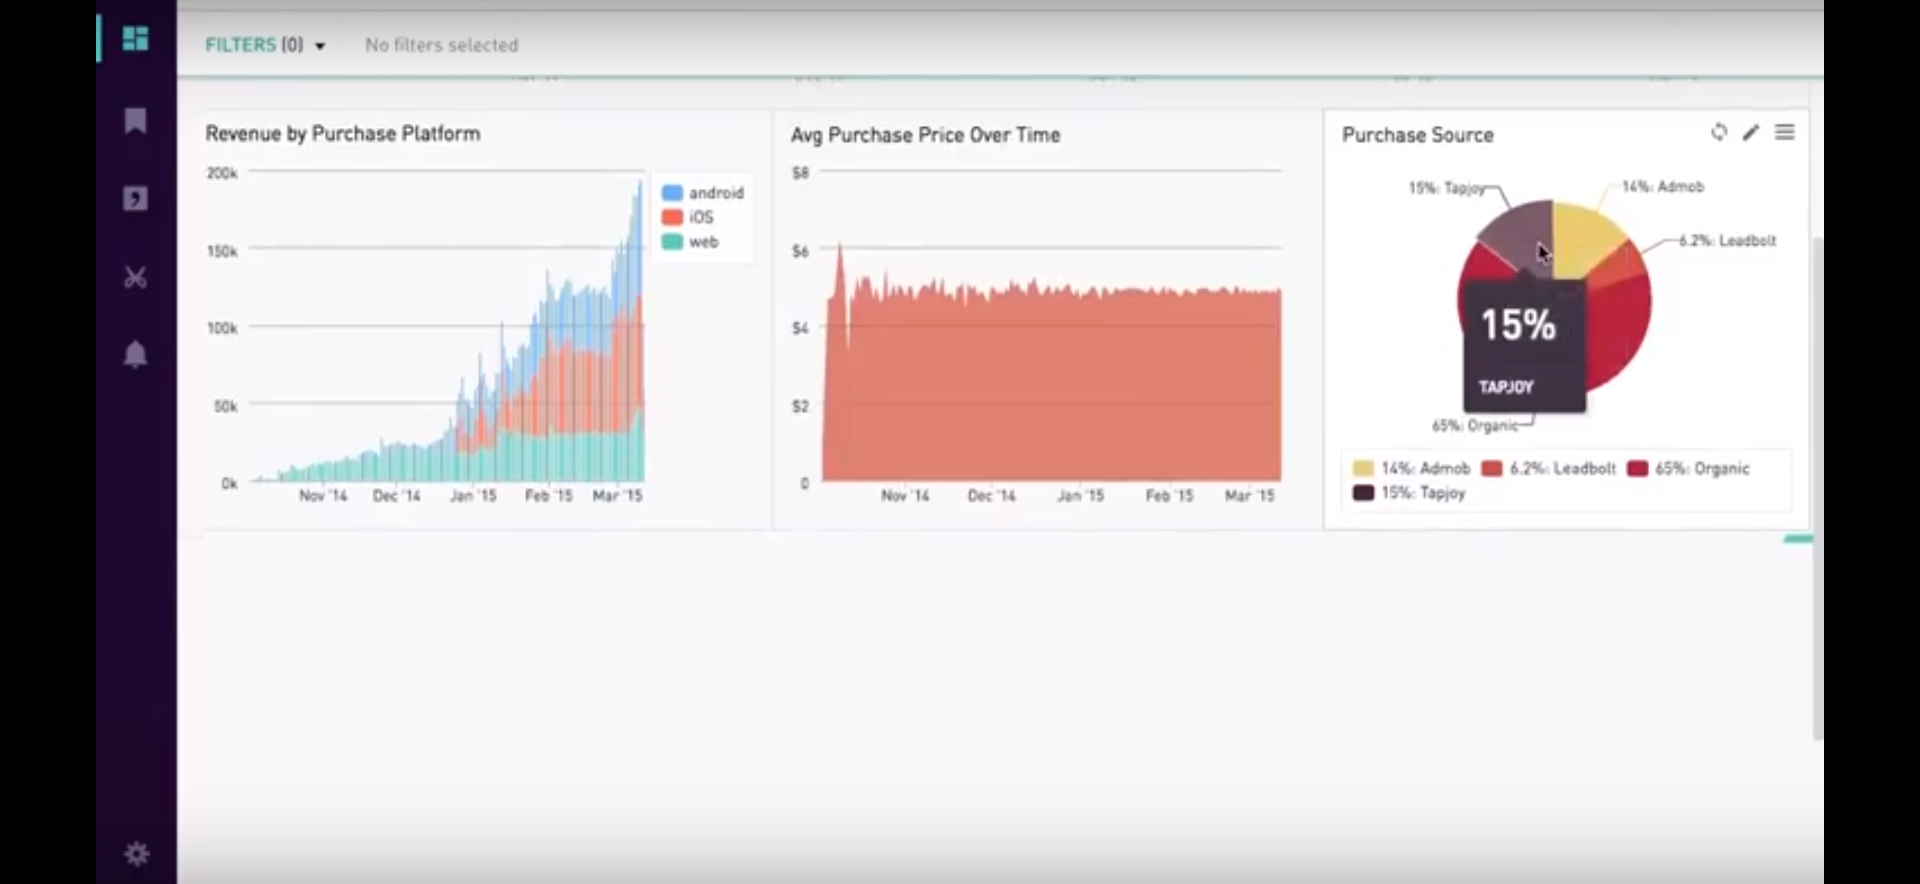
CanvasJS Charts is an HTML5 charting library with superior performance compared to traditional SVG charting libraries, allowing for the creation of rich dashboards that work across devices without compromising on maintainability or functionality.
Strengths
-
Customizable
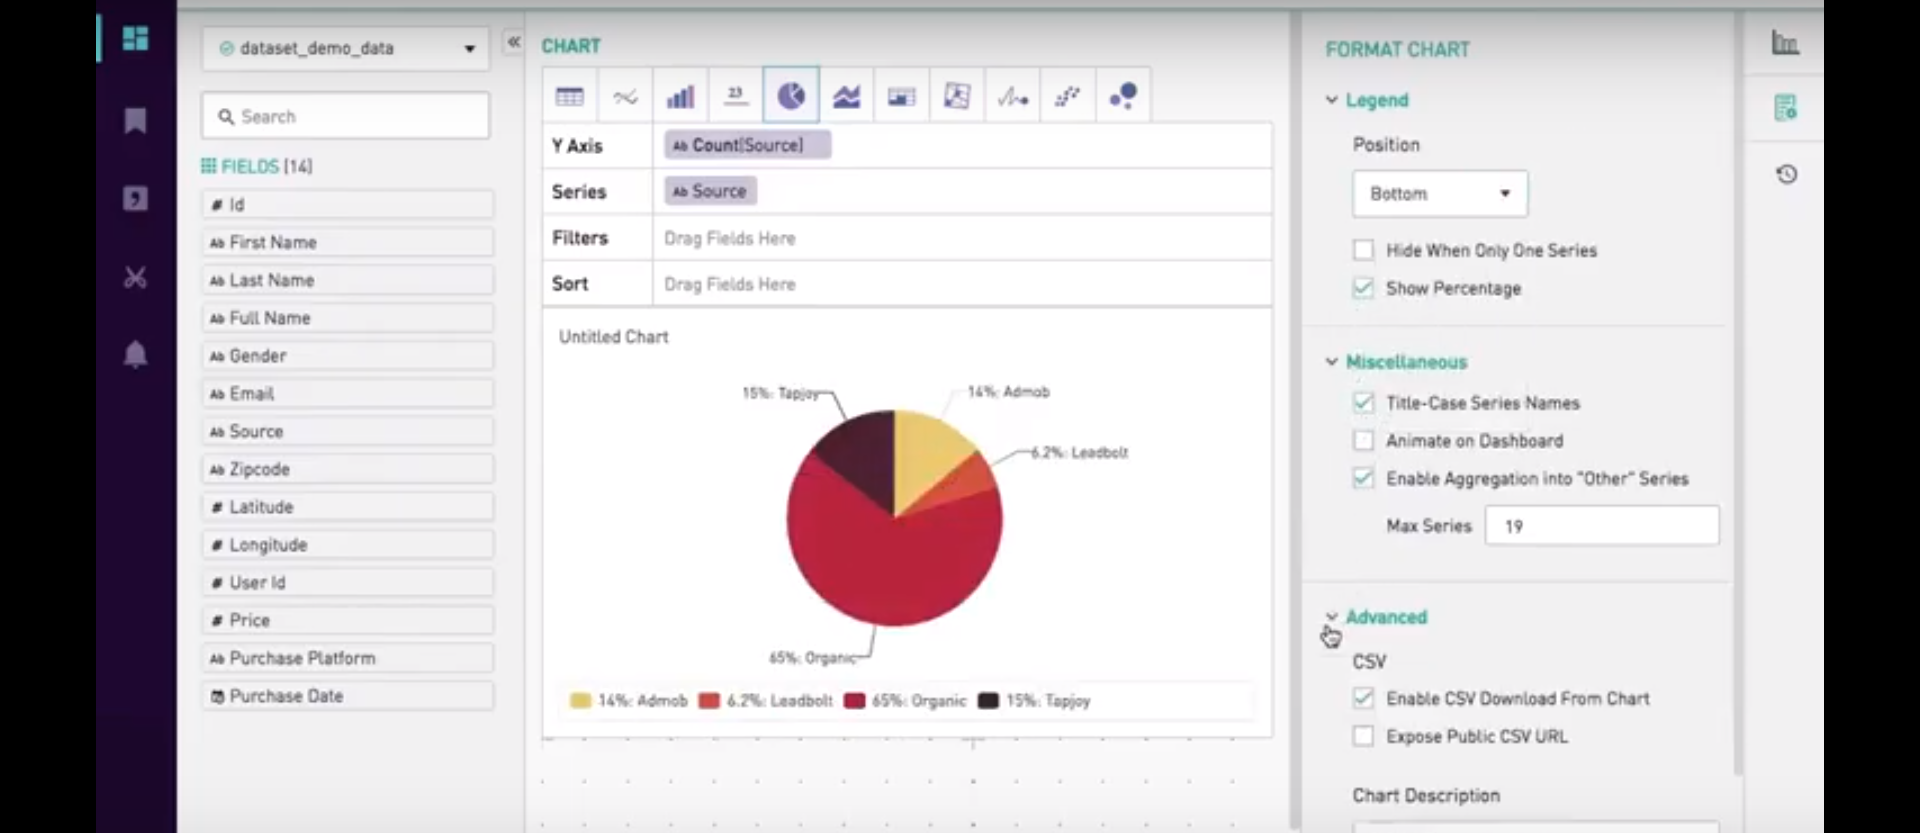
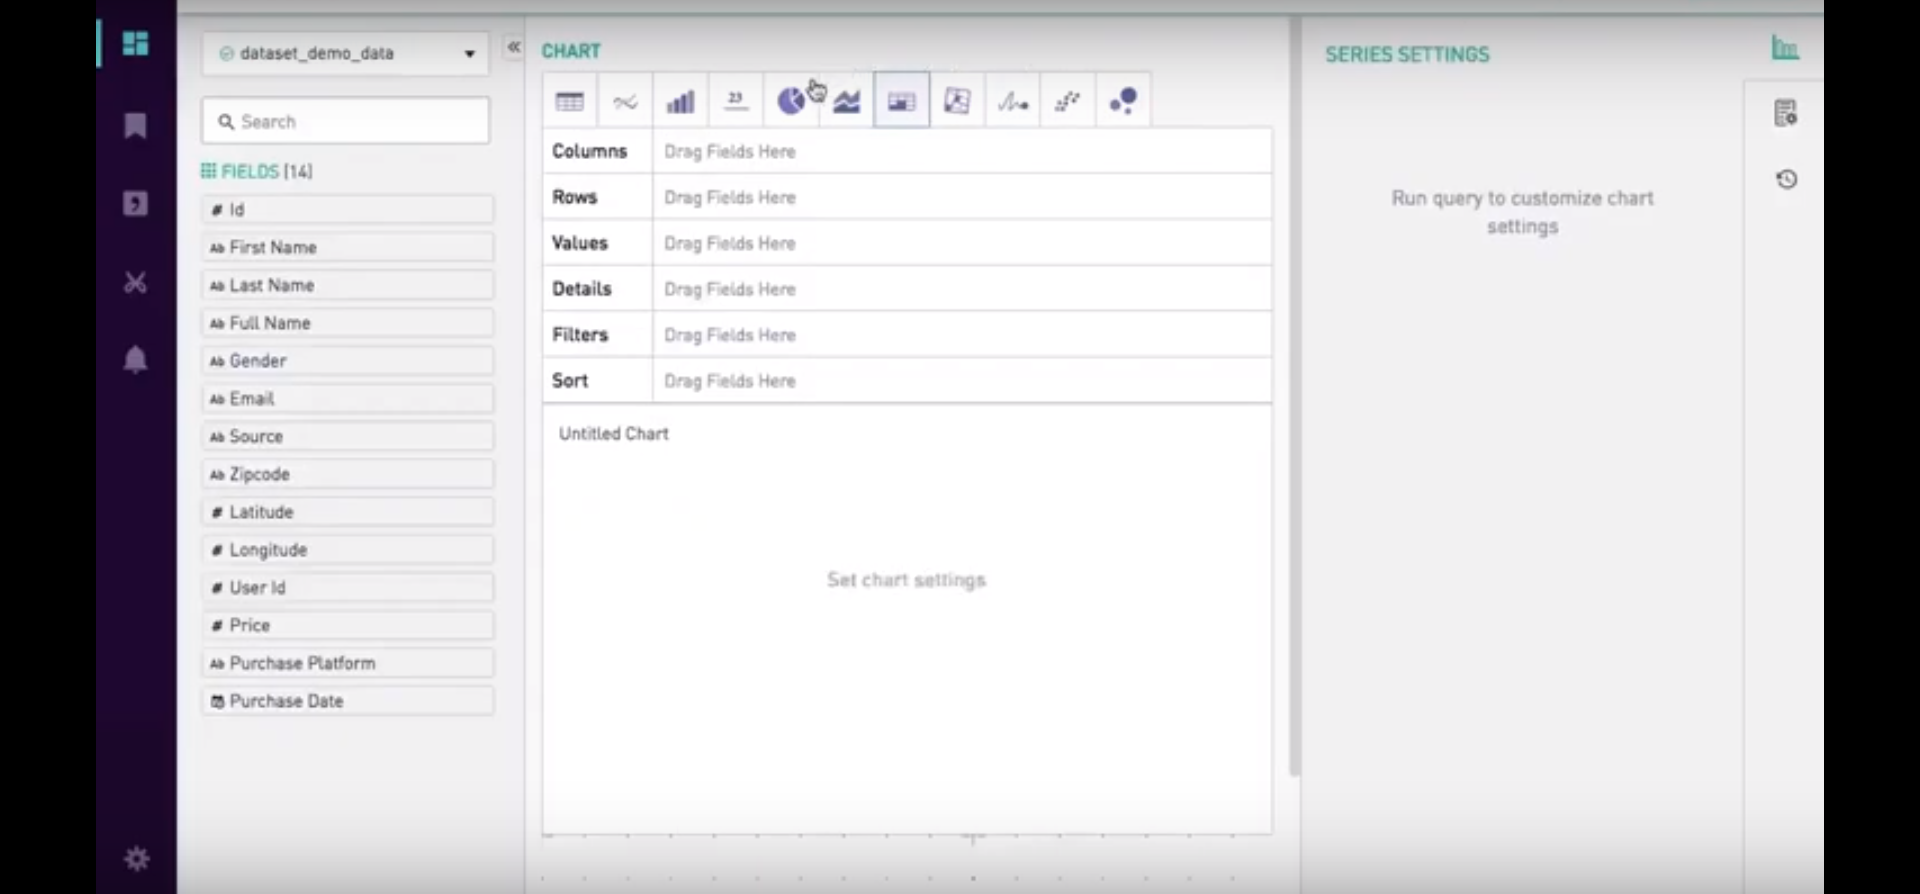
Allows for extensive customization of charts
-
Interactive
Provides interactive features such as zooming and panning
-
Responsive
Charts are responsive and can adapt to different screen sizes
Weaknesses
-
Limited Free Version
Free version has limited features and is not suitable for complex projects
-
Steep Learning Curve
May require some time to learn and master all the features
-
No Real-Time Data Support
Does not support real-time data streaming
Opportunities
- Increasing demand for data visualization tools presents growth opportunities
- Can integrate with other tools such as Angular and React
- Can target new user segments such as mobile app developers
Threats
- Competition from established players such as Tableau and D3.js
- Economic downturn may reduce demand for data visualization tools
- Security concerns may deter some users from adopting the tool
Ask anything of CanvasJS Charts with Workflos AI Assistant
https://canvasjs.com/
Apolo
Squeak squeak, I'm a cute squirrel working for Workflos and selling software.
I have extensive knowledge of our software products and am committed to
providing excellent customer service.
What are the pros and cons of the current application?
How are users evaluating the current application?
How secure is the current application?
 Sign up for free
Media
CanvasJS Charts Plan
CanvasJS Charts offers a free version with limited features and paid plans starting at $149/year with advanced features.
SSO Free Forever
Manage GitHub, IntelliJ IDEA, Visual Studio, Bitbucket, Aurachain, Notepad++, Nimble, OutSystems, GitLab, Salesforce Platform with SSO